Bluetooth Low Energy Basic View
Next to the Device Information tile in the Basic View is a summary of the measurements (for Advertising Interval, Throughput, Packet Error Rate (PER) Packets, and TX Power) and the trend charts. Go to Throughput page for more information about the Throughput measurement.
In this view, you may use the buttons shown below to set the Trigger mode and manage your view of the results (Chart or Table View).
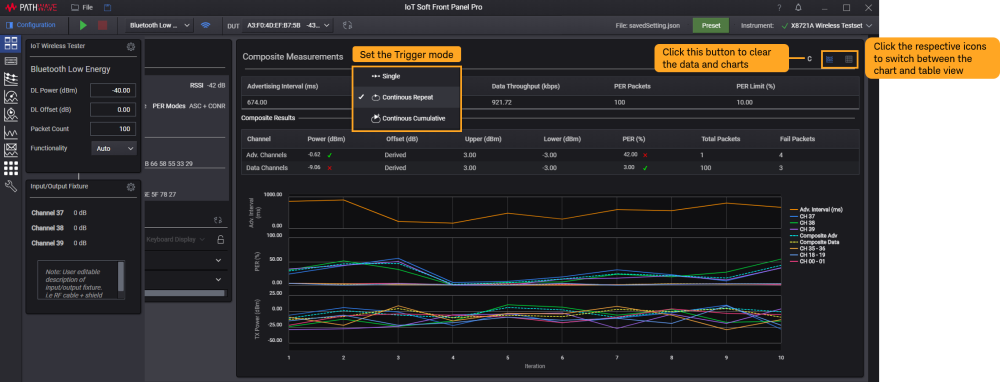
Trigger Mode
The Trigger Mode settings will apply across the Packet Error Rate, Advertising Interval, Throughput, and Transmit Power (when applicable) measurement tiles as indicated in the symbols shown below.
| Trigger Mode | Description |
|---|---|
|
Single |
Configure the software to run a single measurement. |
|
Continuous Repeat |
Set a continuous measurement where the results will be updated at the end of each iteration. The average reading shown will be the current returned data. The minimum and maximum value shown are the observations up to the last iteration. |
|
Continuous Cumulative
|
In a continuous measurement, the PER result is calculated using the sum of failed packets to be divided by the total packets. The average reading shown is the average of all previous data, up to the last iteration. The minimum and maximum value shown are the observations up to the last iteration. |
Chart View
This feature is only applicable when the Trigger Mode is set to Continuous Repeat or Continuous Cumulative. This Chart view is not applicable for the Single Trigger mode.
The chart view will scale automatically as it records new data or results from the DUT. Upon a successful run, you can expect similar results as below. Here are a few features you can use in this view:
- Click any of the items in the legend to show or hide the trace from the chart.
- Hover your mouse across the charts to view the respective X and Y values of a particular point.
- Click the Clear Measurement icon (
 ) to clear the measurement results.
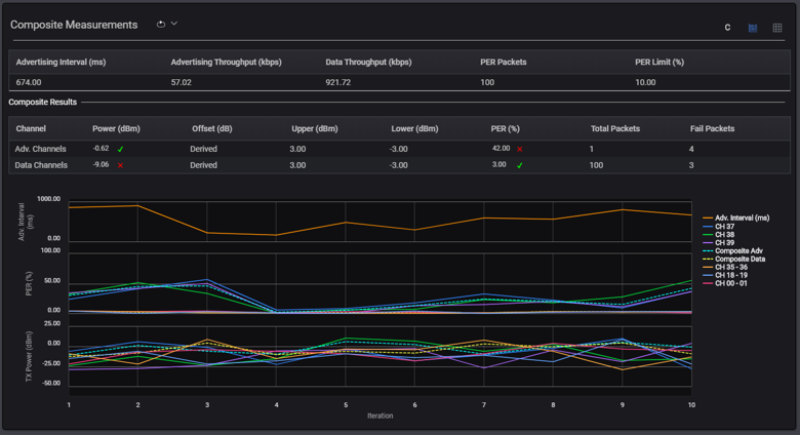
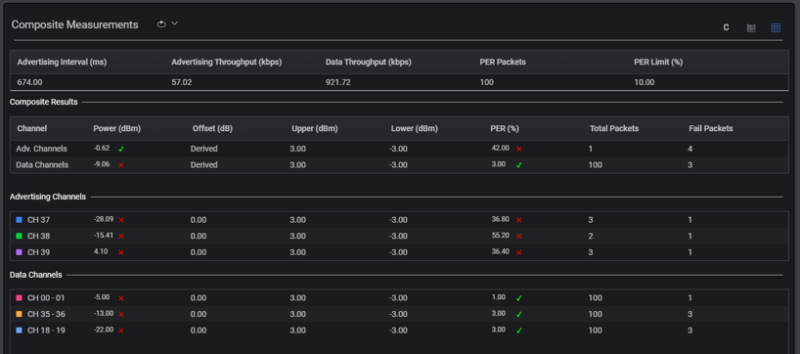
Table View
In this view, you will see the indicators next to each results to indicate a Pass (green check mark) or Fail status (red cross icon). The Composite Results shown above are as defined below.
| Item | Definition |
|---|---|
|
Composite Results |
Display the averaged results of Advertising Interval, Advertising Throughput, and Data Throughput across the respective channels. |
|
Advertising Channels |
Display the averaged results of the advertising channels (Channel 37, 38, and 39) according to the respective columns (TX Power, Packet Error Rate, and Throughput) |
| Composite Data Channels |
Display the averaged result of the data channels according to the respective columns (TX Power, Packet Error Rate and Throughput). |