Chart Properties
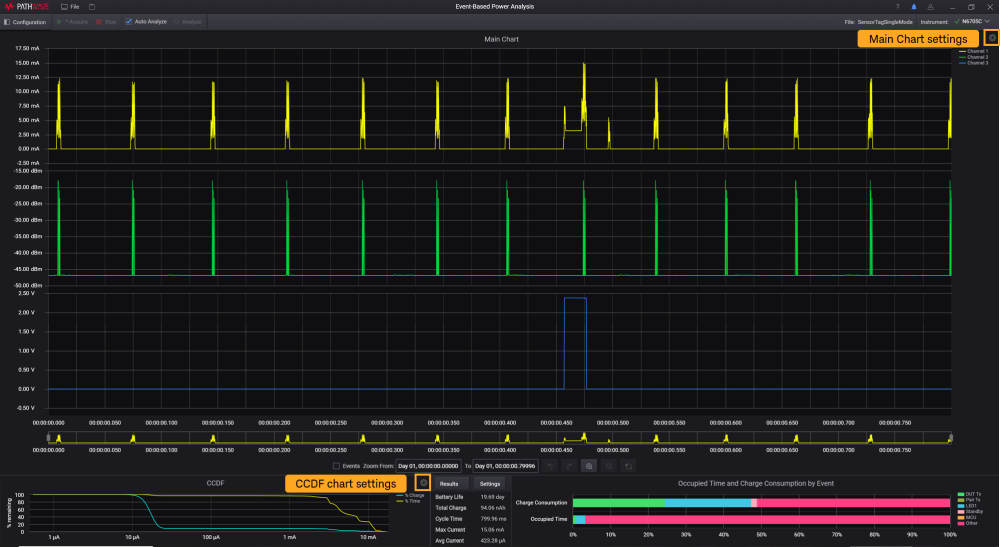
The Main Chart and the CCDF chart in the KS833A2A software have their own Chart Settings that are independent of one another. Click the gear icons shown below to display their settings in a pop-up window.
| Main Chart Settings |
|
|---|---|
|
|
Title Enter the Name of the graph. Default title: Main Chart |
|
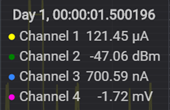
Show values at cursor Select this check box to display the timestamp and the respective X and Y data for each point across four graphs (when applicable) as you move your cursor across the main chart.
|
|
|
Show Legend Select this check box to show the legend where the color of each trace line corresponds to the respective channels. |
|
|
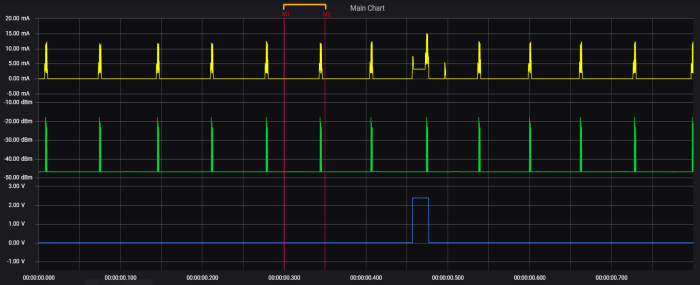
Show Delta Marker Select this check box (
Drag the markers to the desired area of analysis and it will update the corresponding timestamps (M1 and M2) and the delta value as X Delta at the bottom of the chart.
|
|
|
Show Waveforms Select the desired check box to show or hide the respective waveforms in the Main Chart. You must show at least one waveform in this chart. You may modify the title of the vertical axes for each channel. |
|
|
Y-Axis Depending on the types of modules installed in your hardware setup, the units shown on the vertical axes for each waveform may vary.
Auto Scale: Scale the axes automatically to accommodate the entire data series Max and Min: Set the maximum and minimum values of the Y-axis |
|
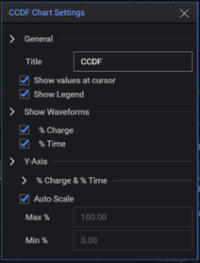
| CCDF Chart Settings |
|
|
|
Title Enter the Name of the graph. Default title: CCDF |
|
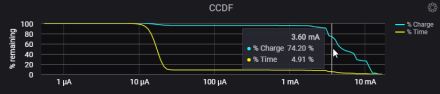
Show values at cursor Select this check box to show the Charge and Time (in percentage) and current (in Log scale) values of waveforms as you move your cursor.
|
|
|
Show Waveforms Select the respective check box to show the Charge in percentage (%) or Time in percentage (%) traces in the CCDF chart. You must show at least one waveform in this chart. The changes made here will be reflected when you close the dialog. |
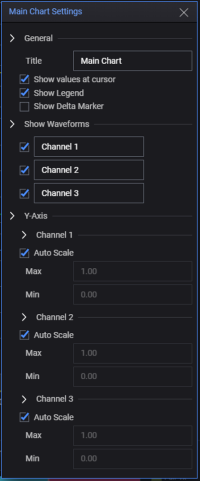
 ) at the Main Chart setting to show the delta markers (in red) in the Main Chart area.