Zoom
Use the zoom feature to magnify the waveforms of the desired area and have it displayed on the Main Chart area. There are a few methods to zoom in and display the desired region in the Main Chart for analysis.
The software will limit the maximum zoom level such that at least 11 samples will be displayed.
| Method | Steps |
|---|---|
| 1 |
Use the Zoom In ( |
| 2 |
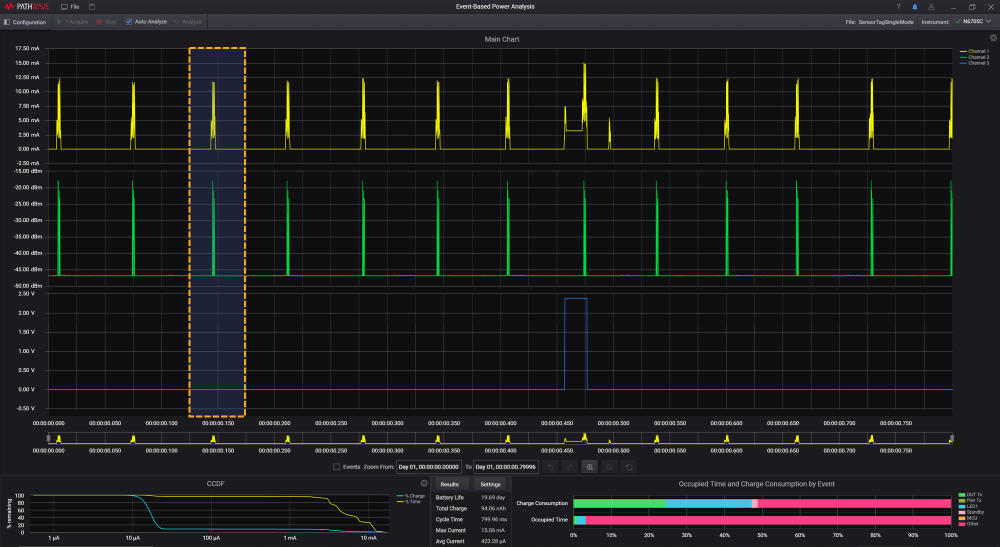
With your cursor, click and drag across the main chart until it covers the desired area for analysis. Release the button on your mouse to zoom in. The Zoom In function will apply across all channels and display the magnified area in the Main Chart area.
|
| 3 |
Enter the desired time span in the Zoom From and To to set the zoom size for analysis. By default, the time here reflects the start and end time of the recorded waveform when the data acquisition process is complete.
|
| 4 |
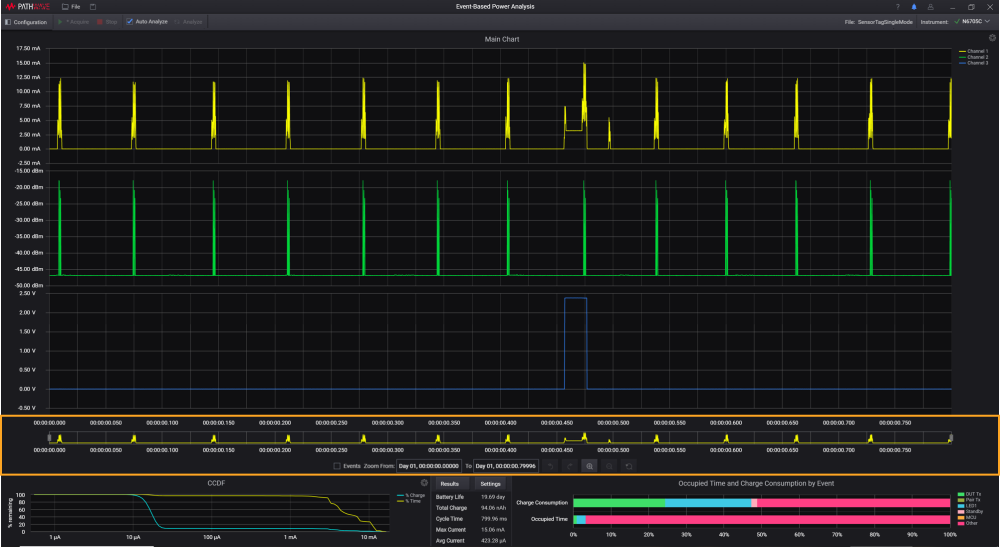
Drag the edges of the Zoom box in the Overview Chart to resize it. You can also click and drag the zoom box to pan it across the chart.
|
| 5 |
Use the Undo Zoom or Redo Zoom button to remove or repeat the most recent action.
|
 ) and
) and  ) buttons. To return to the full view, click Reset Zoom (
 ).
).