Wireless LAN Chart View Settings
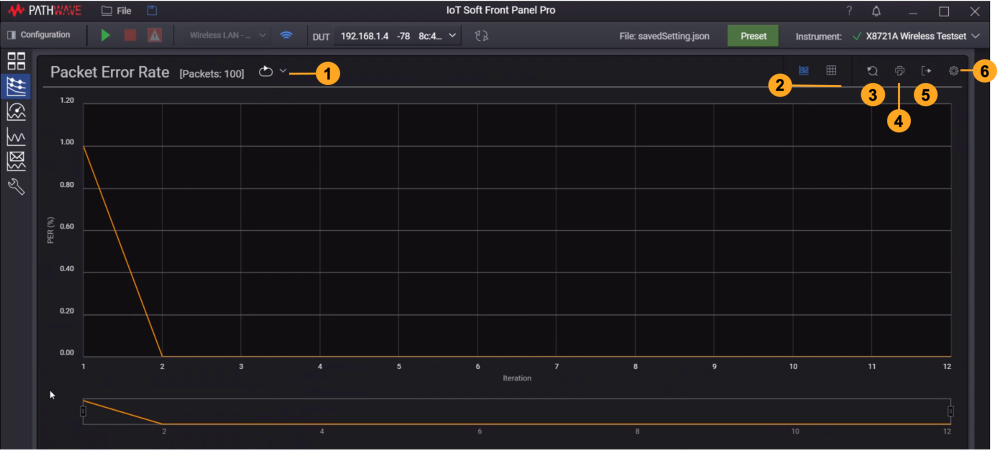
This section describes the commonly used functions available across the measurement pages. Using the Throughput view as an example, refer to the table for the description of the labeled indicators in the image below.
| Item | Function | Description |
|---|---|---|
| 1 | Trigger Mode (Shortcut) |
This is an indicator to show the Trigger Mode set for measurement. In this example, this icon indicates that it is using Continuous Cumulative Trigger mode. Note: The TX Power Envelope measurement is only available in Single Trigger mode. For more information about the types of Trigger modes available, go to Wireless LAN Basic View. |
| 2 | View | Click the respective icons to view the results in Chart or Table view. |
| 3 | Reset Chart | Click this button to return the chart to full extended view. |
| 4 | Print Chart | Click this button to show the print dialog. |
| 5 | Export traces |
Click this button to export the results in a .CSV file. Browse to the desired location and name the file accordingly. |
| 6 |
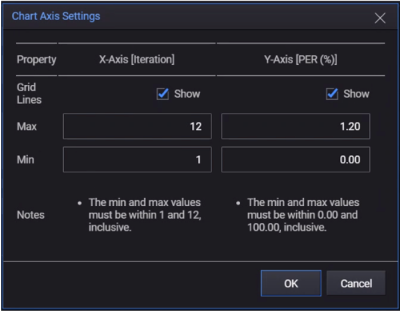
Chart Axis Settings
|
The chart component will scale automatically as it records the measurements. Click the gear icon to show the Chart Axis Settings window.
|