Wireless LAN Chart Views
This section covers the individual chart view that you can access using the side menu of IoT Soft Front Panel Pro.
Running the measurement using Continuous Repeat or Continuous Cumulative Trigger Mode will simultaneously plot the traces in these chart views. This view is not applicable in Single Trigger mode as it only measures a single instance.
The X-axis of the charts will vary depending on the choice of Trigger Mode and is described in Wireless LAN Basic View.
- When the Trigger Mode is set as Continuous Repeat, the X-axis of each chart will show as Number of Iterations.
- When the Trigger Mode is set as Continuous Cumulative, the X-axis of each chart will show as Accumulated Packets.
| Chart View | Results | View |
|---|---|---|
|
Packet Error Rate |
This chart displays the PER trend for the queried channel. |
|
|
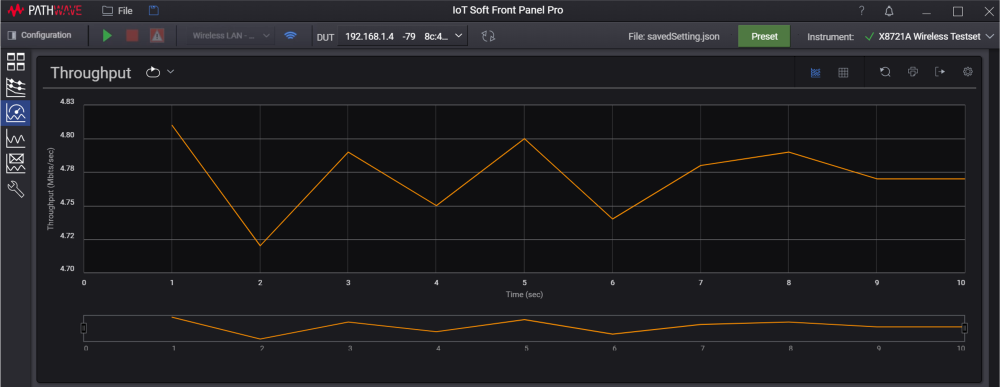
Throughput |
This chart displays the rate at which packets are transmitted by the DUT. |
|
|
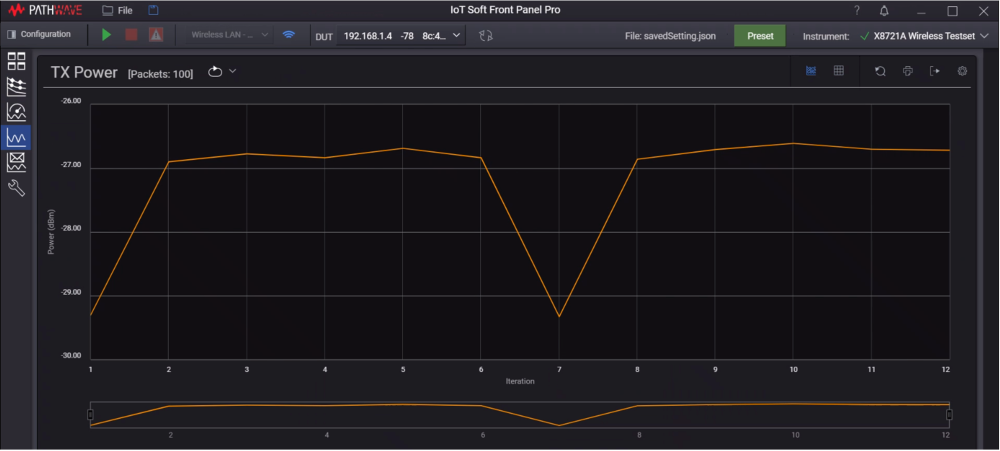
Transmit (Tx) Power
|
This chart displays the recorded transmit power from the specified channel. |
|
|
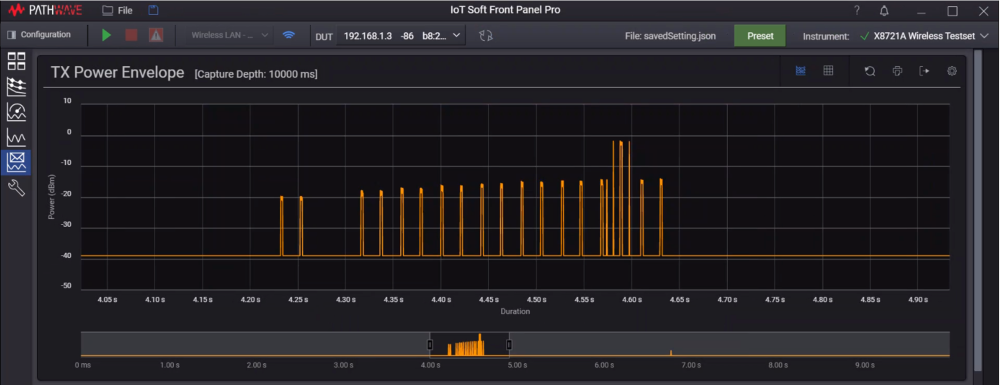
TX Power Envelope |
This chart displays measurements from the power detector as it captures the incoming RF signals from the DUT. Display the data recorded in a single run based on the Capture Depth set. |
|