Bluetooth Low Energy Chart Views
This section covers the individual chart view that you can access using the side menu of IoT Soft Front Panel Pro. The features described in View the Results are applicable in these individual chart views.
Running the measurement using Continuous Repeat or Continuous Cumulative Trigger Mode will simultaneously plot the traces in these chart views. This view is not applicable in Single Trigger mode as it only measures a single instance.
The X-axis of the charts will vary depending on the choice of Trigger Mode and is described in Bluetooth Low Energy Basic View.
- When the Trigger Mode is set as Continuous Repeat, the X-axis of each chart will show as Number of Iterations.
- When the Trigger Mode is set as Continuous Cumulative, the X-axis of each chart will show as Accumulated Packets.
| Chart View | Results | View |
|---|---|---|
|
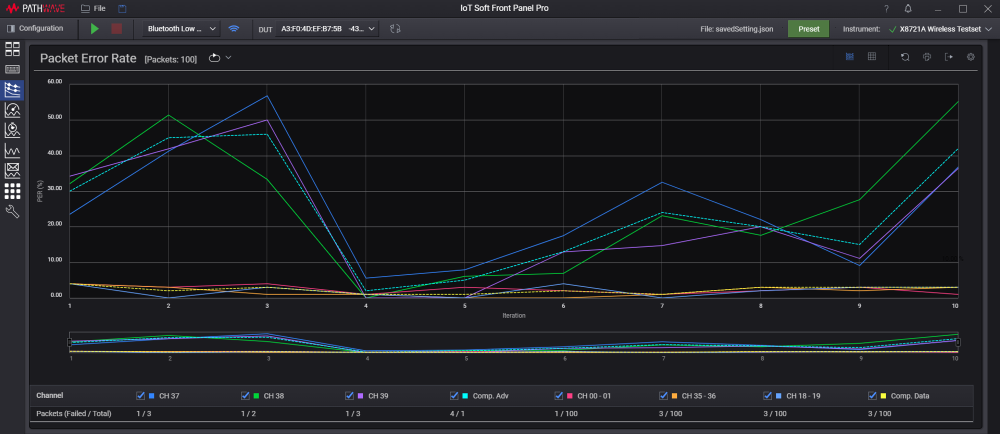
Packet Error Rate |
This chart displays the PER trend for each channel and the ratio of failed and total packets of the last iteration. The Composite trend line is plotted based on the total results of all advertising channels. As for the data channels, the trend line is plotted based on the average results. |
Use the check boxes below the chart to show or hide chart traces.
|
|
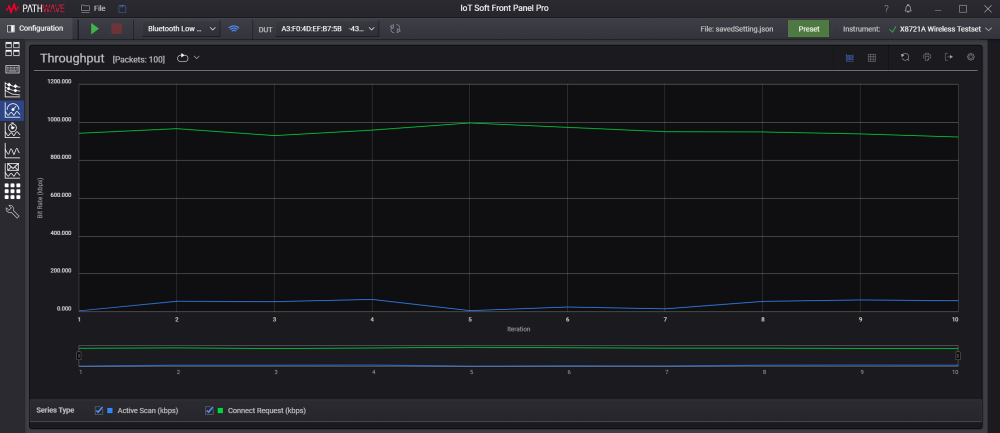
Throughput |
This chart displays the rate at which packets are transmitted by the DUT |
|
|
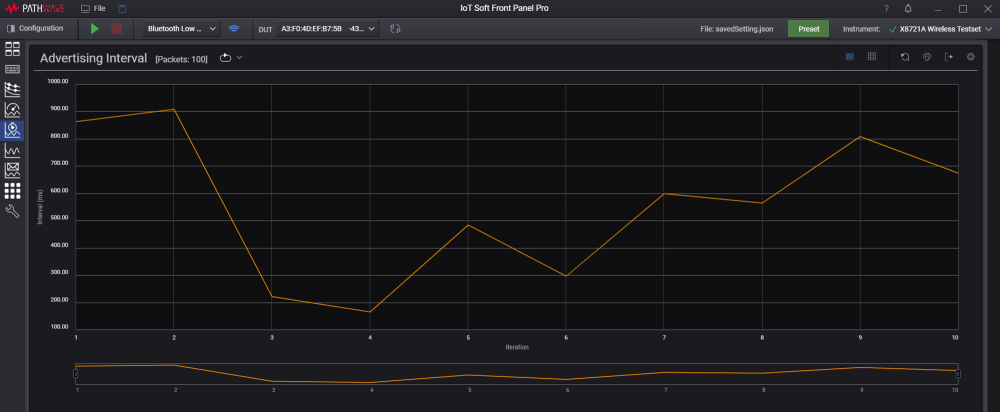
Advertising Interval |
This chart plots the advertising interval at every 100 packets (as per the advertisements shown). |
|
|
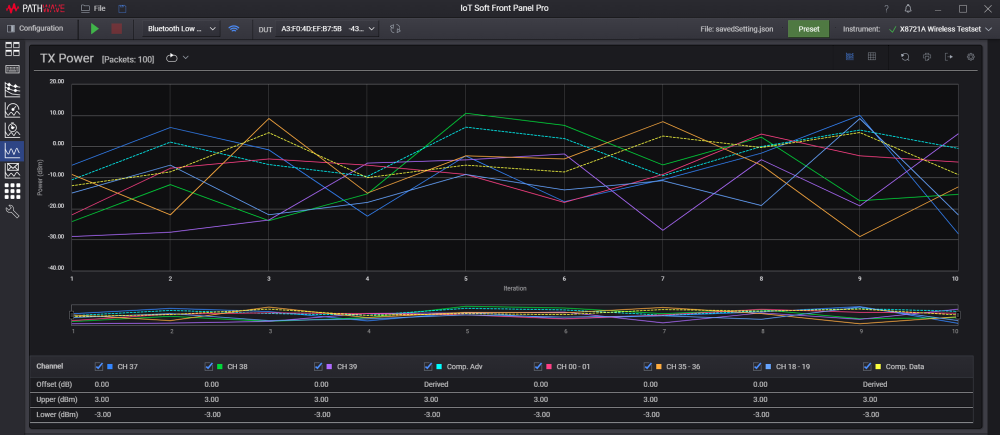
Transmit (Tx) Power
|
This chart displays the recorded transmit power from the advertising channels (Channel 37, 38 and 39). The Composite trend line is plotted based on the average Transmit power obtained from all advertising or data channels respectively. |
Use the check boxes below the chart to show or hide chart traces.
|