View the Results
This section will cover the features that you could use to analyze your results. Upon the completion of the measurement, you will see an overview of the results in the chart view and the summary in table form.
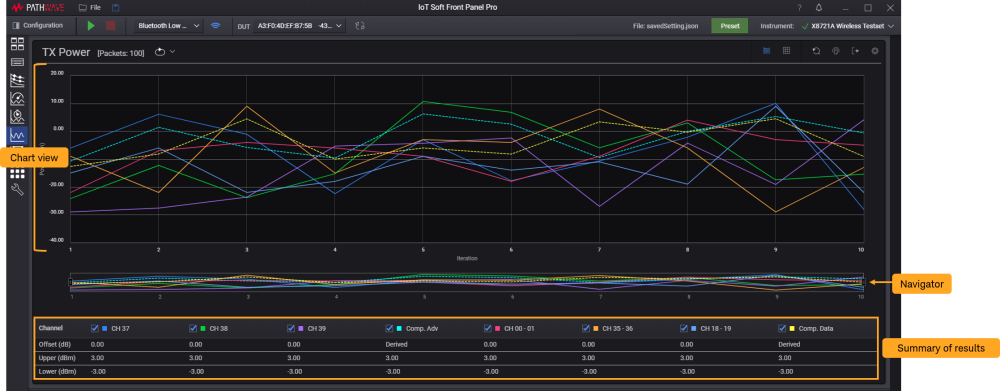
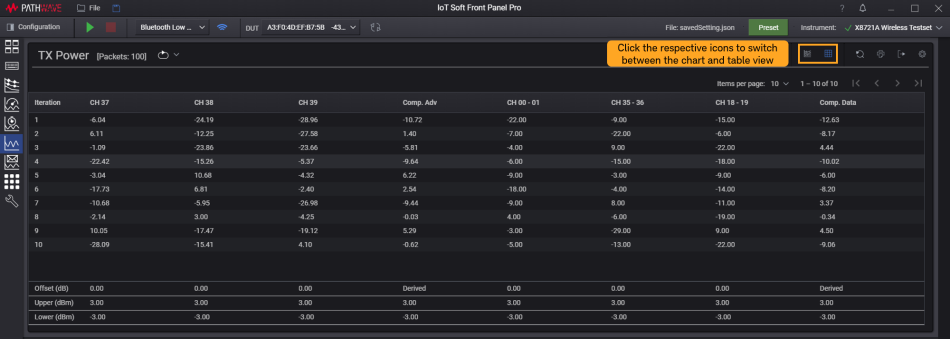
To view the results at each iteration, click to view and change it to Table.
Zoom Features
Use the zoom feature to magnify the waveform or traces of the desired area. Here are a few methods to zoom in and display the desired area of the waveform.
|
|
Methods | View |
|---|---|---|
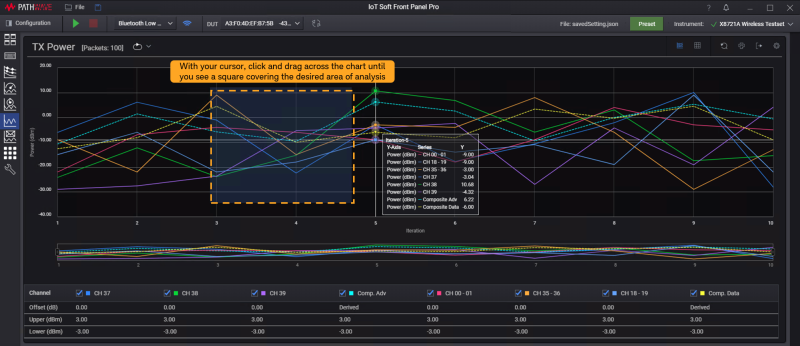
| 1 |
With your cursor, click and drag across the chart until you see a square that covers the desired area of analysis. Release the button to show the magnified area of your chart. your mouse. |
|
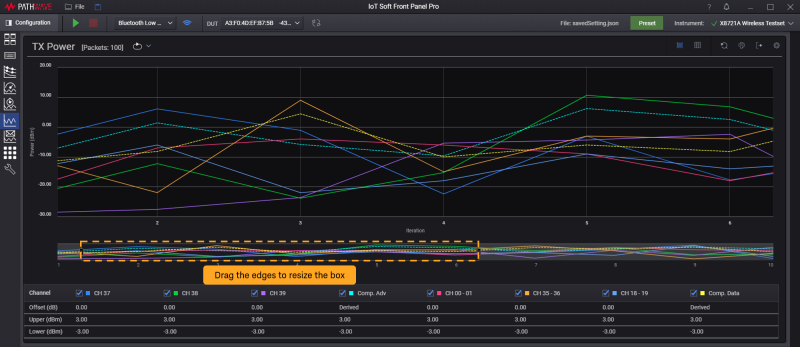
| 2 |
To pan across the chart, press and hold the shift key while using your cursor to drag across the chart. Alternatively, you can resize or drag the active window on the navigator. |
|
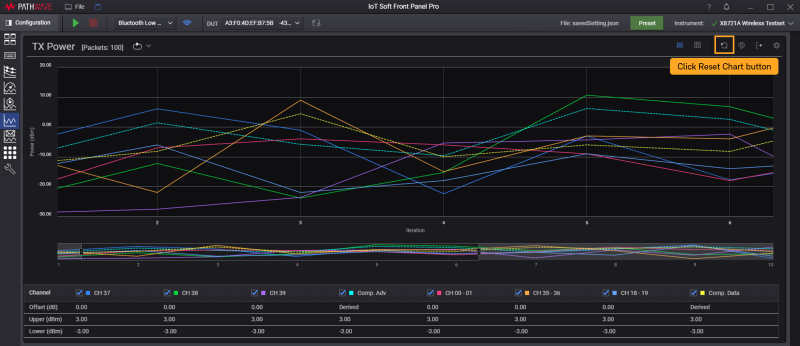
| 3 | Click the Reset Chart button to return to full extended view. |
|
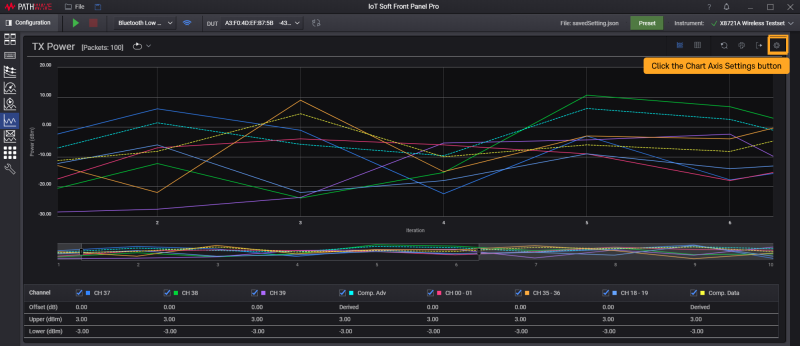
| 4 |
To manually scale your graph, click the Chart Axis settings and set the minimum and maximum values of the X and Y axes to show in the chart. You can also modify the Division setting and set a different interval for the X and Y axes when displaying the points in the chart. |
|
Here are a few additional features that you can use in the Chart view.
| Features | Description and Steps |
|---|---|
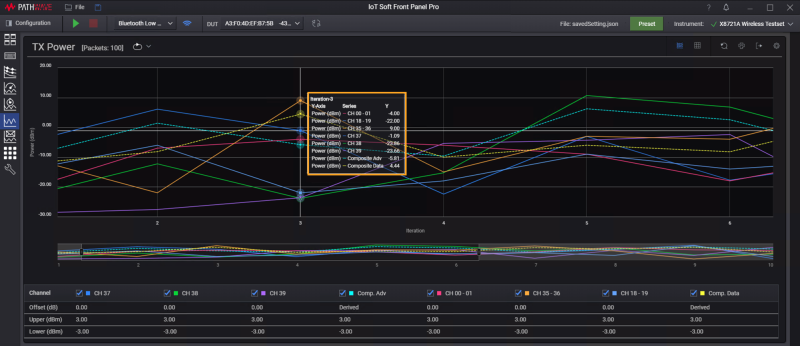
| Show values on cursor |
Display the respective X and Y data for each point across graphs as you move your cursor across the charts.
|
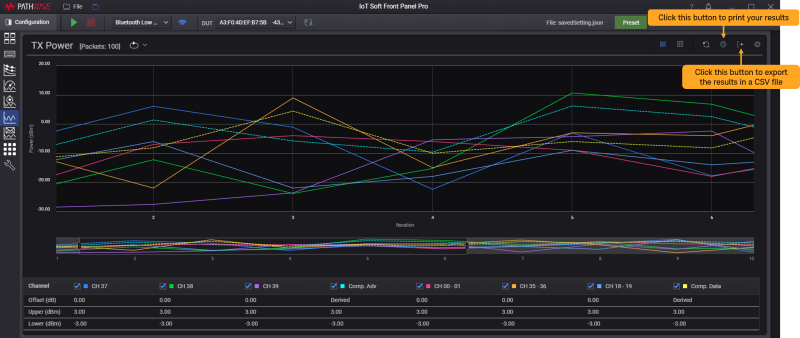
|
Export or Print results For more information about the settings available in the Chart View, go to Chart View Settings. |
|
Next
- For instructions on how to upgrade the firmware of the X8721A IoT Wireless Test Set, go to Perform Firmware Upgrade.
- To perform self tests on the X8721A, go to Perform Self-Test.