View Results
The Viewer service provides a visual representation of result data using charts. Visualization gives a contextual and analytical perspective of the result. The Viewer, using its data analysis features, also allows you to manipulate the dataset. PathWave Desktop Edition opens the Viewer tab when:
- a service sends the results data to be displayed as a chart. For example, after a successful execution of a test plan PathWave Test Automation invokes the Viewer.
- you double-clicked a results data file in the Project Tree pane.
| # | Description |
|---|---|
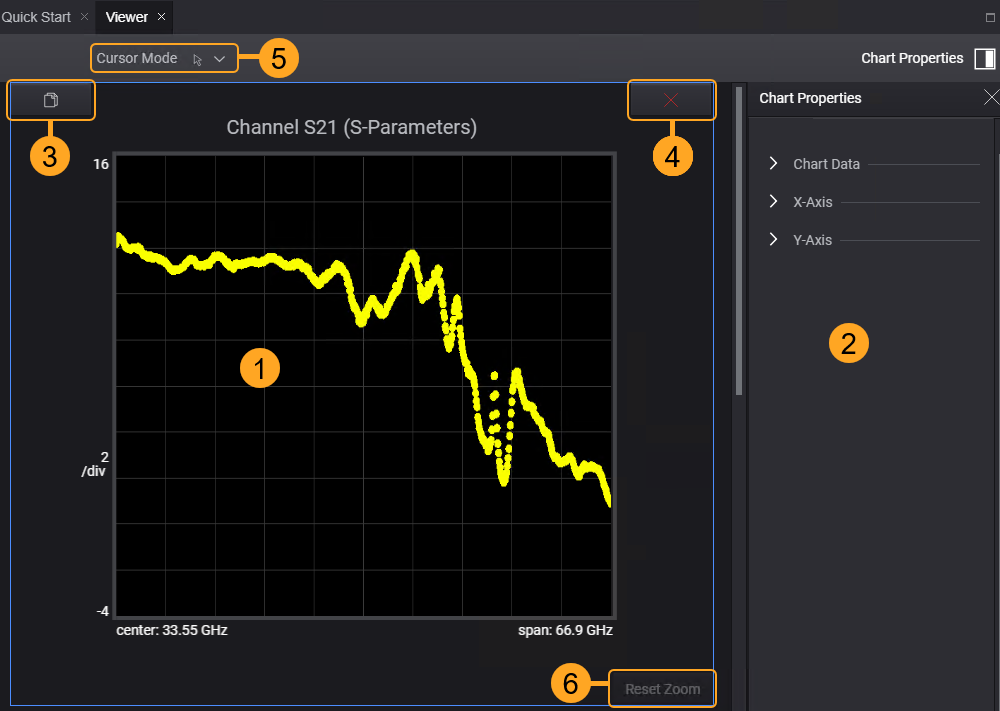
| 1 | The chart area displays the result data in a chart or table format. |
| 2 | The Chart Properties panel lets you customize your view of the data. For more information, see Customize the Chart. |
| 3 |
Clone a chart. Click to create a copy of the chart. When multiple charts are displayed, the Chart Properties applies to the selected chart (click chart area to select the chart). The selected chart is highlighted with a blue border. Cloned chart uses the same data set. |
| 4 | Close a cloned chart. Click to close the selected copy of the chart. The button is grayed out when only one chart is displayed. |
| 5 |
Cursor Mode. The icon displays the current cursor mode.
|
| 6 | Reset Zoom. The option is enabled when you zoom in on a chart. |
See Also
- Customize the Chart
- Supported Chart Types
- Split and Filter Data
- Zoom In and Zoom Out
- Group and Ungroup Data Series in Charts