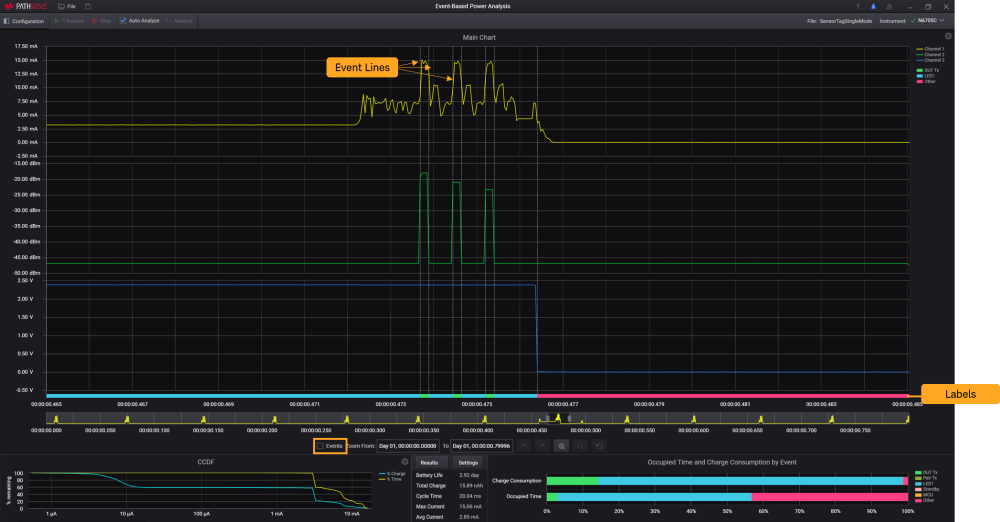
Event Line and Label
Selecting the Events check box will show or hide the vertical lines which functions to segregate the waveforms according to the respective events based on the upper and lower threshold set in Settings. Refer to the legend to identify the type of events as indicated in the Label.
It is recommended to only enable this feature when you have narrowed down the area to analyze your results. The KS833A2A software uses the resampling data method to increase the accuracy of the data displayed as you zoomed in on the charts.
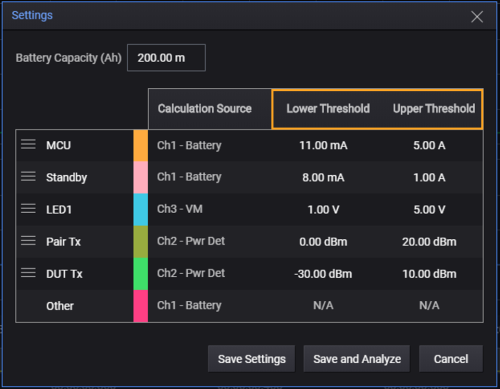
For post measurement analysis, you can set the threshold values in the Settings window to specifically calculate the occupied time and charge consumption of a specific event. The description of these functions are in Settings.
For more information of the types of events, go to Physical and Current Events.