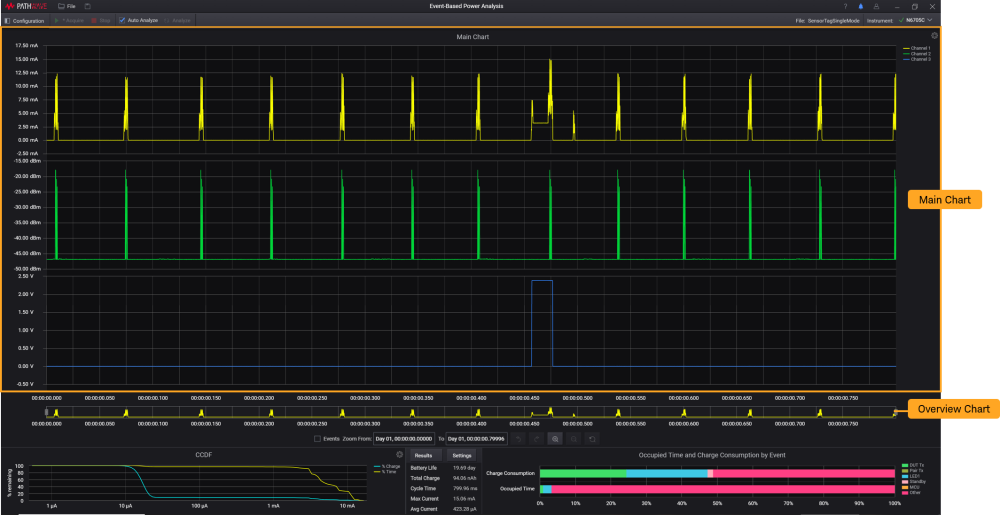
Main Chart
The Main Chart is the designated area to display the waveforms recorded from Channel 1 to 4, subject to the number of channels set and configured. This section includes the Overview Chart where it displays the complete waveform recorded for Channel 1 (in yellow) in a minimized view. You must select to view at least one waveform in the Main Chart.
The software will limit the maximum zoom level such that at least 11 samples will be displayed.
For information on settings and functions that you can use in this area, go to
Data Resampling
The Event-Based Power Analysis is capable of acquiring about 9700 samples per second. To visually display large sums of data the overall number of data presented to the graphing engine must be reduced. To reduce the amount of data to display, we have developed an algorithm to resample the data. The resampling algorithm preserves the characteristics of the data such that it will faithfully represent the full dataset at a much lower resolution. The algorithm preserves the minimum and maximum values of the data at all times.
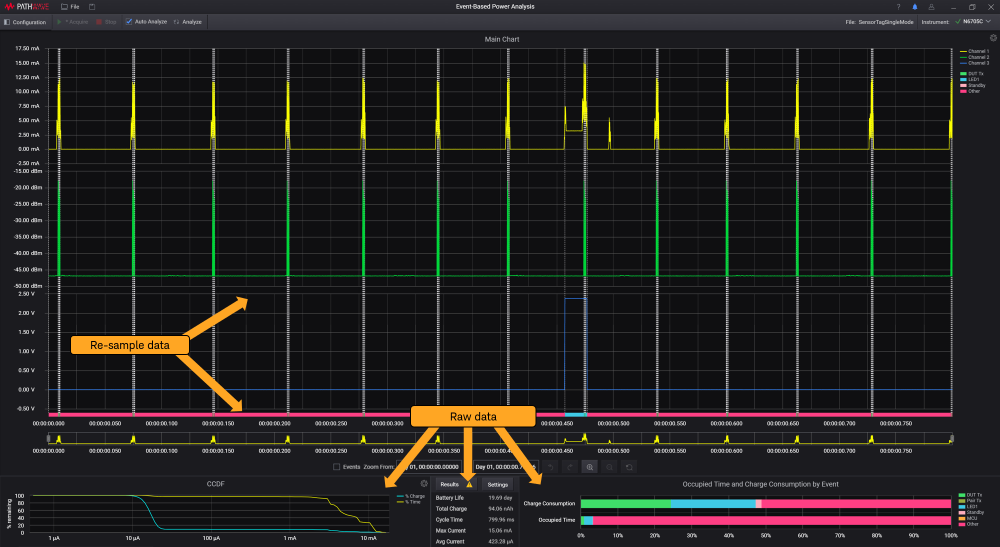
As indicated in the image below, the Main and Overview charts are plotted based on re-sampled data while the CCDF chart, analysis results, and the Occupied Time and Charge Consumption by Event bar charts use raw data (full dataset) for calculation.
Calculations are always based on the full dataset.