Run the Measurement
At this point, verify the settings in the software and ensure that your hardware is connected properly.
- Turn on your DUT and place it in the shield box. Close the shield box. On the IoT Soft Front Panel, ensure that you select the DUT based on the MAC address or friendly name from the drop-down.
-
Click Run (
 ) to begin the measurement according to your choice of Trigger Mode. Click Stop (
 ) to stop the data acquisition at any time of the measurement. Observe the progress spinner.
  NOTE
NOTERunning the measurement using Continuous Repeat or Continuous Cumulative Trigger Mode will simultaneously plot the traces in these chart views (as described in Bluetooth Low Energy Chart Views). Using Single Trigger mode will only populate the results in the table view (as described in Bluetooth Low Energy Basic View).
- Once the software completes the measurement, it will enable the Run button and you will no longer see the progress spinner. You should now see the measurement results as shown below.
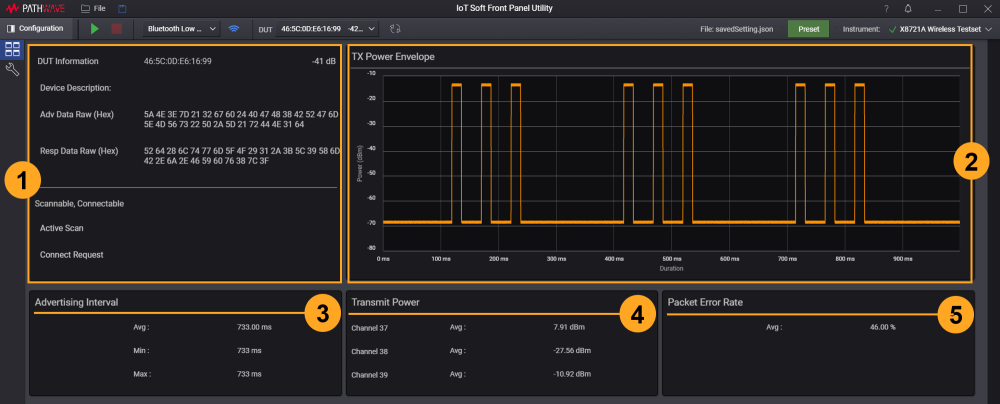
- In IoT Soft Front Panel Utility, you will see the averaged measurements for Advertising Interval, Transmit Power (for Channel 37, 38, and 39), and Packet Error Rate tests from a single run as shown below. For more information, go to Basic View.
In IoT Soft Front Panel Pro, you will be able to see the average, minimum, and maximum values for above-mentioned measurements. Next to the composite results in the table are indicators that represent the Pass (green check mark) or Fail (red cross icon) status.
Click the icons in the side menu to view the respective charts as indicated below.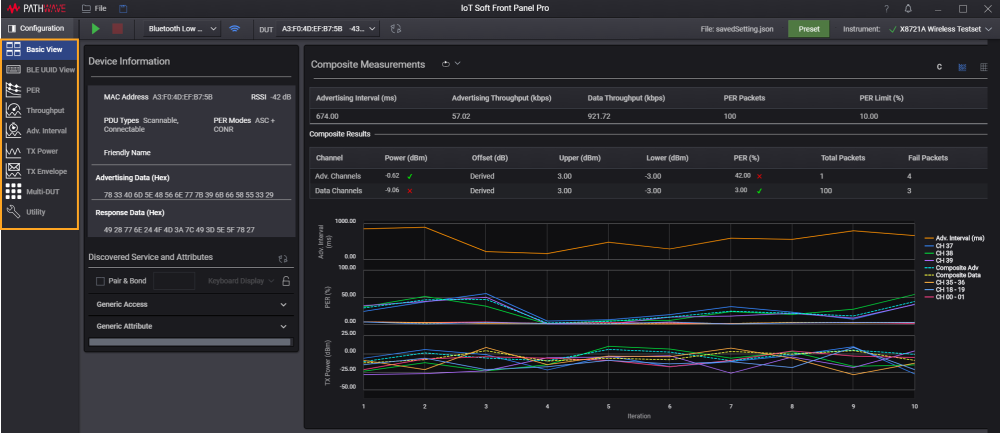 NOTE
NOTE- When the test is configured to use the Continuous Trigger mode, you will see the trend charts in the Basic View that plots the measurements against time. Upon the completion of the test, click the icons here to switch between the Chart (
 ) and Table view (
 ).
). - When the test is configured to use the Single Trigger mode, the User Interface will show the table view instead of the trend chart.
For more information, go to Bluetooth Low Energy Basic View.
- When the test is configured to use the Continuous Trigger mode, you will see the trend charts in the Basic View that plots the measurements against time. Upon the completion of the test, click the icons here to switch between the Chart (
- In IoT Soft Front Panel Utility, you will see the averaged measurements for Advertising Interval, Transmit Power (for Channel 37, 38, and 39), and Packet Error Rate tests from a single run as shown below. For more information, go to Basic View.
Next
Now that you have successfully acquired your results, go to View the Results to learn the tips and features that you could use to analyze your results.