Analysis Results and Charts
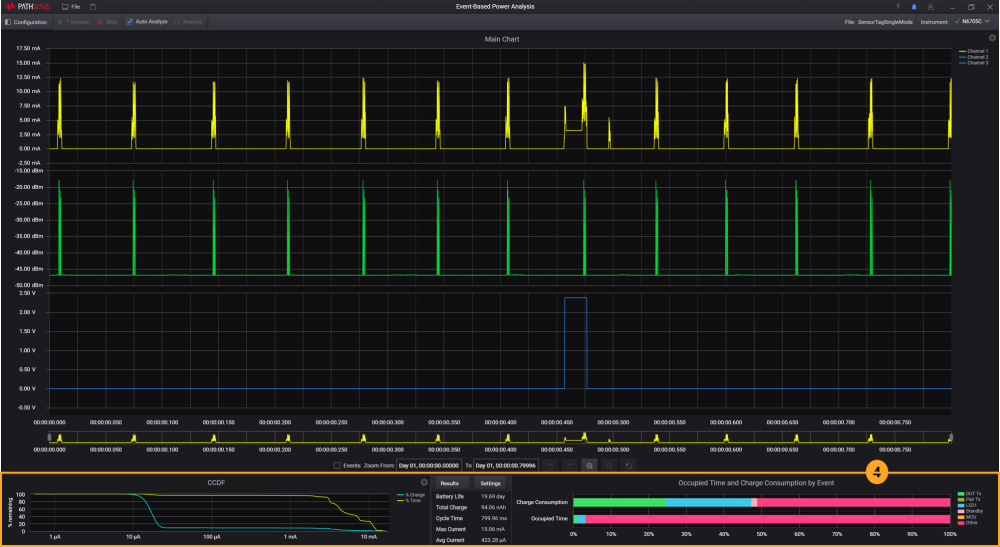
This section introduces the two other types of charts which are Complementary Cumulative Distribution Function (CCDF) and Occupied Time and Charge Consumption. The analysis results and charts will be updated based on the zoom area.
CCDF
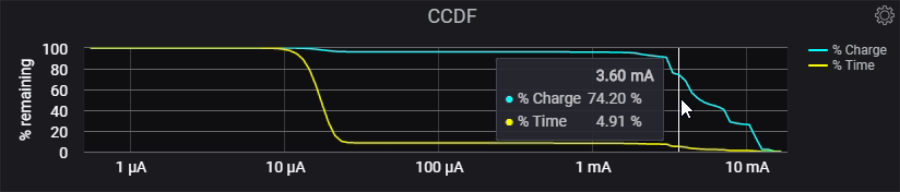
The Complementary Cumulative Distribution Function (CCDF) chart is a graph of the probability that a signal is at or above a given current level. Default Y axes for the traces in the CCDF graph represents:
- Time in percentage (%) for the yellow trace
- Charge in percentage (%), for the blue trace
With the Data series tooltip feature (enabled by default), you can move your cursor across the chart to view respective X and Y values. The two traces will display the same values for the X axes which is the current in Log scale. For more information about the CCDF Chart settings, go to Chart Properties.
As an example in the chart below only 4.91 % of the time is the current equal to or above 3.60 mA, but of the total charge consumed only 74.20 % is due to current levels equal to or greater than 3.60 mA.
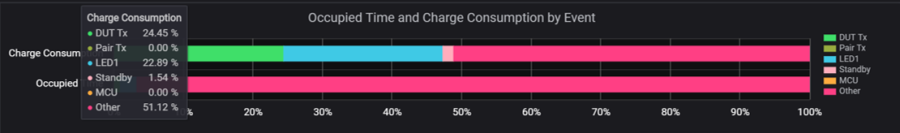
Occupied Time and Charge Consumption by Event
This bar chart is a summary of the results related to the Occupied Time and Charge Consumption by Event. Hover your mouse at the bar chart to see the values for each event.
Next
This section is consists of the following: