View the Results
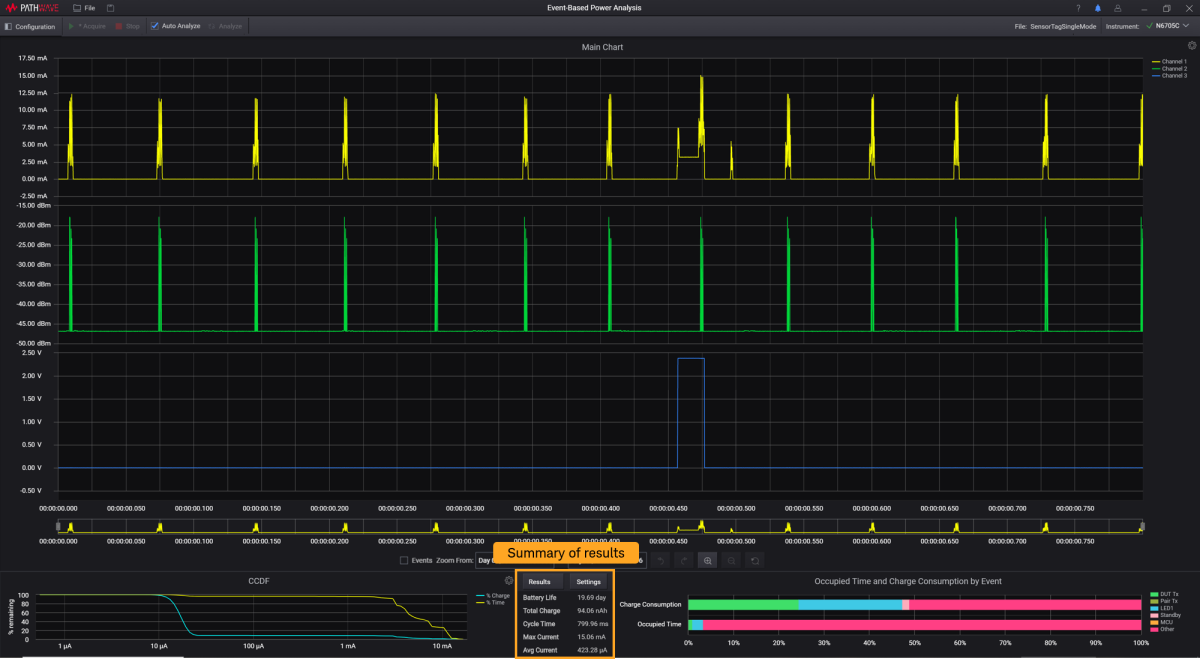
When the data acquisition is complete, you should see the waveforms in the Main Chart and a summary of the Results as highlighted below. This section will explain the features that you can use to interpret your results.For more information on the types of results and charts, go to Analysis Results and Charts.
Perform the following steps to save the computing time when dealing with large amount of data. The summary shown in Results will be updated accordingly using the data from the area of analysis.
- Turn off the Auto-Analyze feature and use the Analyze button to manually update the results.
Note: During the results analysis, turning on the Auto-Analyze feature may consume more time to compute the results especially when you have a large data. It is recommended to only select the Auto-Analyze check box only after you have narrowed down the desired area for analysis.
- When handling large data, drag the edges of the Zoom box in the Overview chart to quickly narrow down the area of analysis before using the Zoom In or Zoom Out buttons individually to view more details of the waveforms. Other methods to zoom in and out are as described in Zoom.
- It is recommended to clear the Events check box. This will reduce the computing time for the software to display the event lines and labels in the Main Chart.
Features
|
1
|
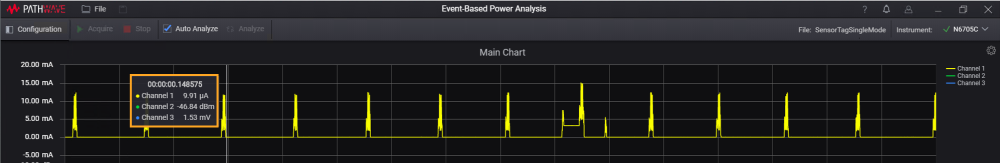
A summary of the results is as shown below and click the Results button to view more information. The results shown here will be updated accordingly when the Auto-Analyze feature is enabled. The definition of each results are as described in Results.
|
|---|---|
|
2
|
Turn on the tooltips. Go to Main Chart settings and select the Show values at cursor check box.
|
|
3
|
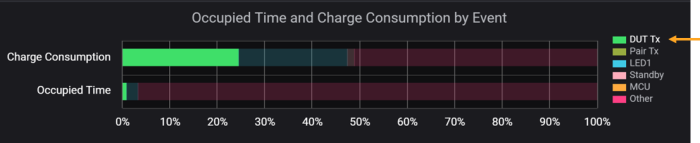
Hover your mouse over to the legend of Occupied Time and Charge Consumption by Event bar charts to highlight the respective events in the chart.
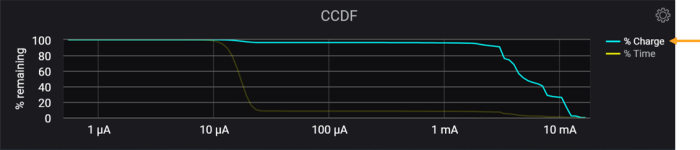
Do the same for CCDF chart to highlight the graph for % Time or % Charge.
|
|
4
|
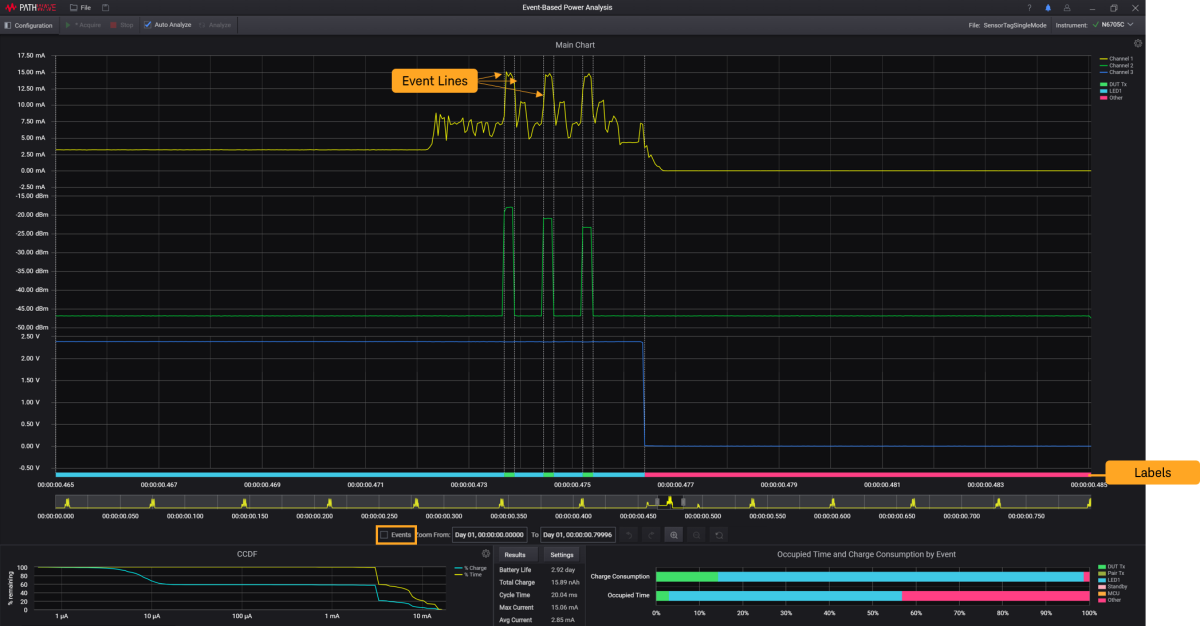
Select the Event check box to show the event tagging lines on the Main Chart.
The labels shown corresponds to the events as assigned in Settings. For more information about this feature, go to Event Line and Label. For more information on the type of events, go to Physical and Current Events. |